Chapter 3. Creating a dataset for PCA-MSPC
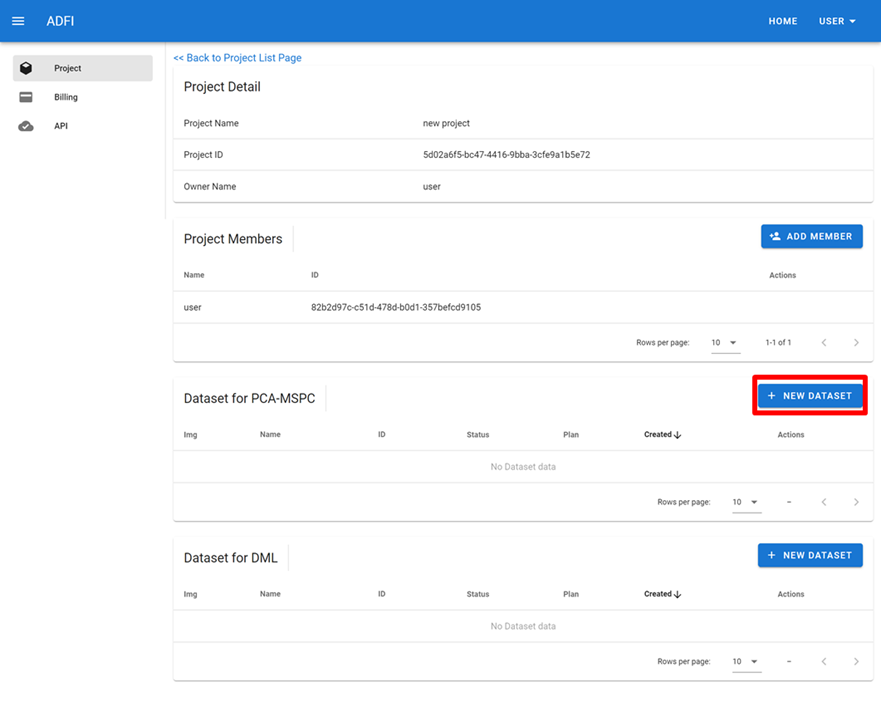
Input the dataset name from “NEW DATASET”, and create a new dataset.
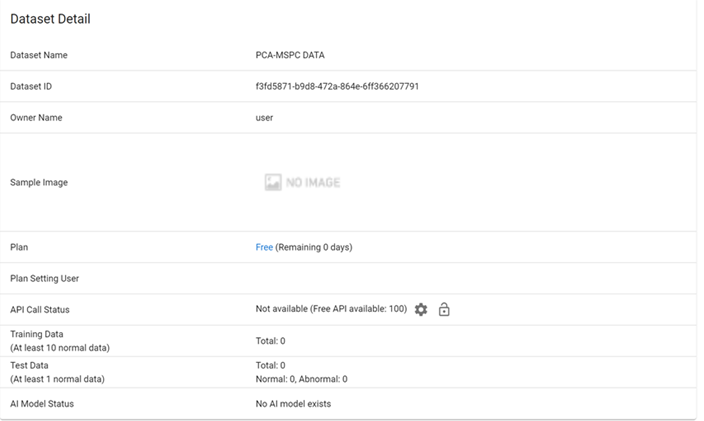
[Explanation of table]
| Dataset Name | Name of the dataset |
| Dataset ID | ID of the dataset |
| Owner Name | User name who created the dataset |
| Sample Image | Display of newest stored image of the dataset |
| Plan | Contract service plan for the dataset Free: No charge Pay-per-use: 0.01 US$/time Light: 400 US$/month Standard: 1,200 US$/month |
| Plan Setting User | User name who changed the plan for the dataset |
| API Call Status | API call status for the dataset Available: API call available Not available: API call not available Restricted: API call not available (temporarily suspended) |
| Training Data | Number of training image data items stored in the dataset |
| Test Data | Number of test image data items stored in the dataset |
| AI Model Status | Creation status of AI model for the dataset ・No AI model exists ・Learning in progress ・AI model creation complete ・Test in progress |
3-1. Image storage for creating and checking AI model
From the “AI MODEL” tab, store normal/anomalous images for use in training or testing.
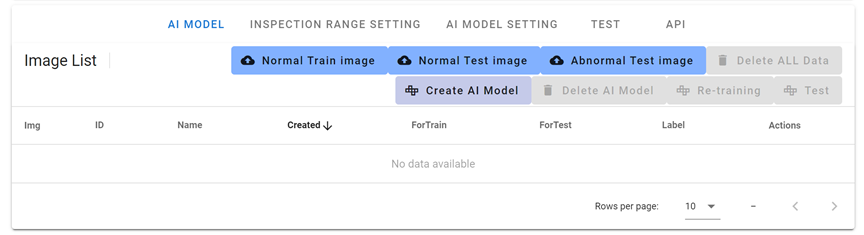
[Explanation of image storage button]
| Normal Training image | Store normal image for training in the dataset |
| Normal Test image | Store normal image for testing in the dataset |
| Anomalous Test image | Store anomalous image for testing in the dataset |
| Delete ALL Data | Delete all stored image data in the dataset |
[Prescribed number of images]
| Minimum number of images | Maximum number of images | |
|---|---|---|
| Normal Train Image | 10 images | Free: 100 images Basic: 200 images Standard: 5000 images |
| Normal Test Image | Total: 1 images | |
| Anomalous Test Image |
Note 1) High-resolution image data is resized automatically to a resolution of 800px or less because it takes time to create an AI model.
Note 2) Images cannot be uploaded in excess of the maximum number.
Note 3) More than 100 images cannot be uploaded at one time.
Stored images can be checked from the “Img” image icon.
3-2. Setting inspection range
If image data contains regions unnecessary for inspection, or you want to perform partial inspection, two methods are available: one where the user prepares and uploads processed images trimmed to the just the part for inspection, and another where the inspection range is set with the ADFI service.
The trouble of processing images beforehand can be eliminated by designating the inspection range with ADFI.
Select the “INSPECTION RANGE SETTING” tab, and select the inspection range from the displayed sample images. This inspection range is applied to all images uploaded in the same dataset.
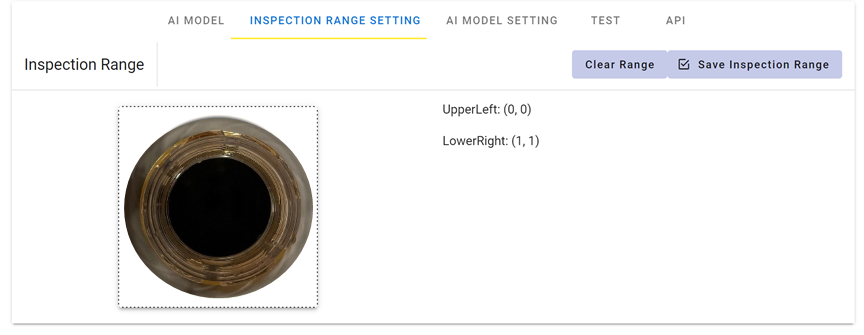
| Clear Range | Resets display of the inspection range for the dataset to the default |
| Save Inspection Range | Saves the selected inspection range of the dataset |
Note 1) Coordinates of the inspection range are displayed as rates, with a minimum value of 0 and maximum value of 1.
Note 2) The inspection range can be set before creating an AI model. If you want to set the inspection range again, first delete the AI model.
3-3. AI model creation and re-learning
After storing image data for at least the prescribed minimum number of images, the next step is creation of an AI model.
Select the “Create AI Model” button under the “AI MODEL” tab.
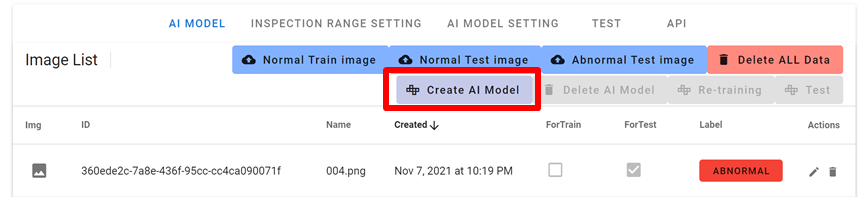
| Create AI Model | Creates an AI model for the inspection range part of the images stored in the dataset |
| Delete AI Model | Deletes AI model created for the dataset |
| Re-training | Performs re-learning and testing of the AI model for the dataset |
| Test | Performs testing using the AI model created for the dataset |
The status of AI model creation at this time can be checked with AI Model Status under Dataset Detail.
Creation of the AI model is completed in 10–30 seconds.
Also, if you want to change the image data for training after creating an AI model, and reflect that in learning results, perform re-learning of the AI model with “Re-Training”.
3-4. AI model testing and judgment threshold setting
AI model learning results are checked, and the threshold values for determining whether a product is good or defective are set, by using the normal/anomalous images for testing.
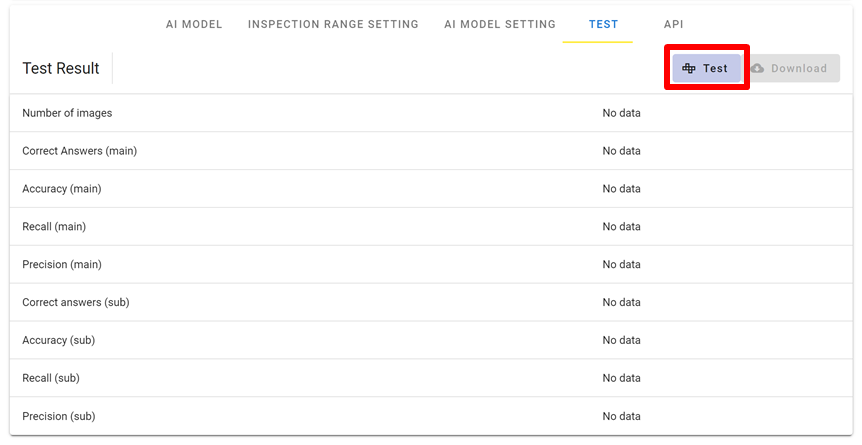
Select the “Test” button on the “AI MODEL” tab, or select the “Test” button on the “TEST” tab.
Test progress can be checked with “AI Model Status.”
[Explanation of TEST tab]
| Number of images | Total number of test images in the dataset, combining both normal and anomalous images |
| Correct Answers(main) | Correct answers of main threshold for the dataset (number of times normal/anomalous was correctly judged) |
| Accuracy(main) | Accuracy of main threshold for the dataset (rate at which normal/anomalous was correctly judged) |
| Recall(main) | Recall of main threshold for the dataset (rate at which anomaly was detected for anomalous images) |
| Precision(main) | Precision of main threshold for the dataset (rate at which images detected as anomalous were actually anomalous images) |
| Correct answers(sub) | Correct answers of sub threshold for the dataset (number of times normal/anomalous was correctly judged) |
| Accuracy(sub) | Accuracy of sub threshold for the dataset (rate at which normal/anomalous was correctly judged) |
| Recall(sub) | Recall of sub threshold for the dataset (rate at which anomaly was detected for anomalous images) |
| Precision(sub) | Precision of sub threshold for the dataset (rate at which images detected as anomalous were actually anomalous images) |
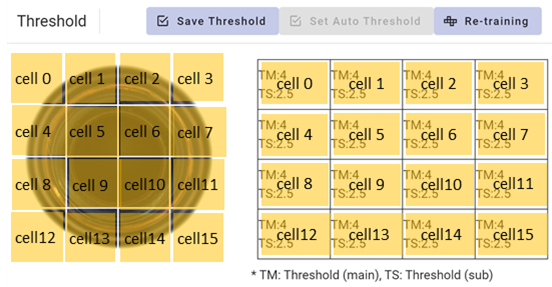
After testing the AI model, the judgment threshold is set for 16 partitioned cells.
When the “AI MODEL SETTING” tab is selected, an image of the designated inspection range is displayed.
Two judgment thresholds, TM and TS, can be selected for each cell.
* TM: Threshold (main), TS: Threshold (sub)
By setting the two thresholds to different values, they can be used as follows.
・The judgment is “Anomaly” if the judgment result exceeds the TM threshold.
・The judgment is “Not-clear” if the judgment result is between the TM and TS thresholds. (Re-inspection is done visually.)
・The judgment is “Normal” if the judgment is below the TS threshold.
Note 1) There is no problem even if the large-small relationship of the TM and TS values is reversed.
Note 2) The default values for TM and TS are set as follows. TM: 4, TS: 2.5
Referring to the detailed results of testing explained in the next section, and the histogram under the “AI MODEL SETTING” tab, input the numerical threshold values for each cell, and set with the “Save Threshold” button.
If the “Set Auto Threshold” button is selected, the optimal threshold is set based on test results.
Be sure to perform “Re-training” after thresholds have been set. This will regenerate the AI model to reflect the set thresholds.
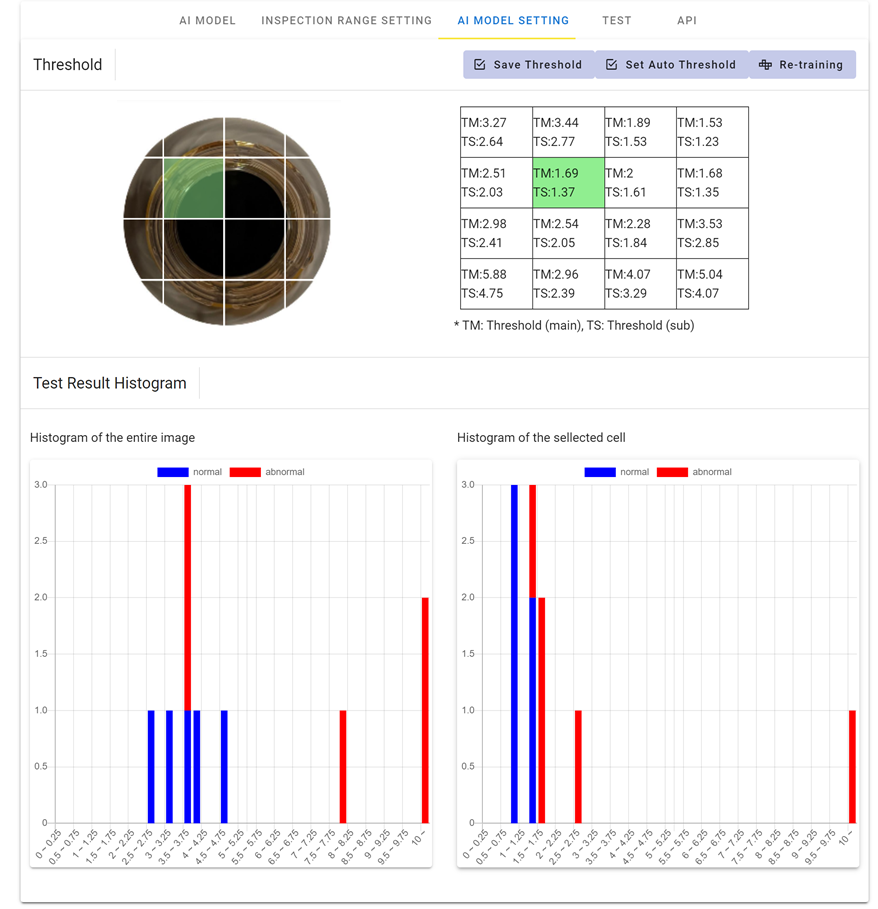
[[Explanation of test result histogram]
| Histogram of the entire image | Maximum anomaly score for images among the test results for the dataset |
| Histogram of the selected cell | Anomaly score for selected cell among the test results for the dataset |
Setting the threshold for each cell lower than the anomalous image score increases recall (rate at which anomaly was detected for anomalous images), but decreases precision (rate at which images detected as anomalous were actually anomalous images). Even if an image is anomalous, the value will be close to the score for a normal image if there is no anomaly in the selected cell, and therefore, this is set to a value higher than the score for that anomalous image.
Also, if an image for testing is opened from the “Img” icon on the “AI MODEL” tab, the results of judgment using the thresholds are displayed in different colors.
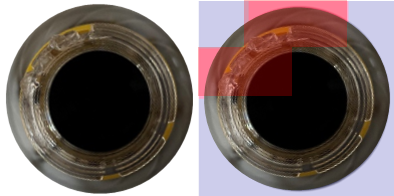
Left: Original image, Right: Results of threshold judgment
Red cell: Cell exceeding the main threshold, Orange cell: Cell exceeding sub threshold
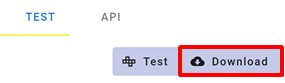
3-5. Downloading test results
Details on test results can be downloaded from the TEST tab in csv format.
[[Explanation of test result table]
| id | id no. of test image in the dataset |
| name | Image file name used for test in the dataset |
| true_label | Identification label indicating whether the test image for the dataset has been uploaded as normal or anomalous 0: Normal test image 1: Anomalous test image |
| anomaly_score (max_score_of_all_cells) | Maximum anomaly score for all cells of the test image |
| prediction_label(main) | Image judgment result for test image using TM threshold 0: Anomaly score for all cells less than TM 1: Anomaly score for all cells at or above TM |
| prediction_label(sub) | Image judgment result for test image using TS threshold 0: Anomaly score for all cells less than TS 1 Anomaly score for all cells at or above TS |
| cell_0_score… cell_15_score | Anomaly score for each cell of test image |
Nos. for each cell are allocated as follows.